

Telemetry#
Overview#
The RAPIDS team collects build-time and test-time telemetry from our CI jobs. These data are used to provide insights into potential speed impacts and optimizations that might be worthwhile.
Intended audience#
Operations
Table of contents#
Introduction#
This is an overview of how telemetry data is collected, how it is transmitted and recorded, and how visualizations can be obtained using Grafana.
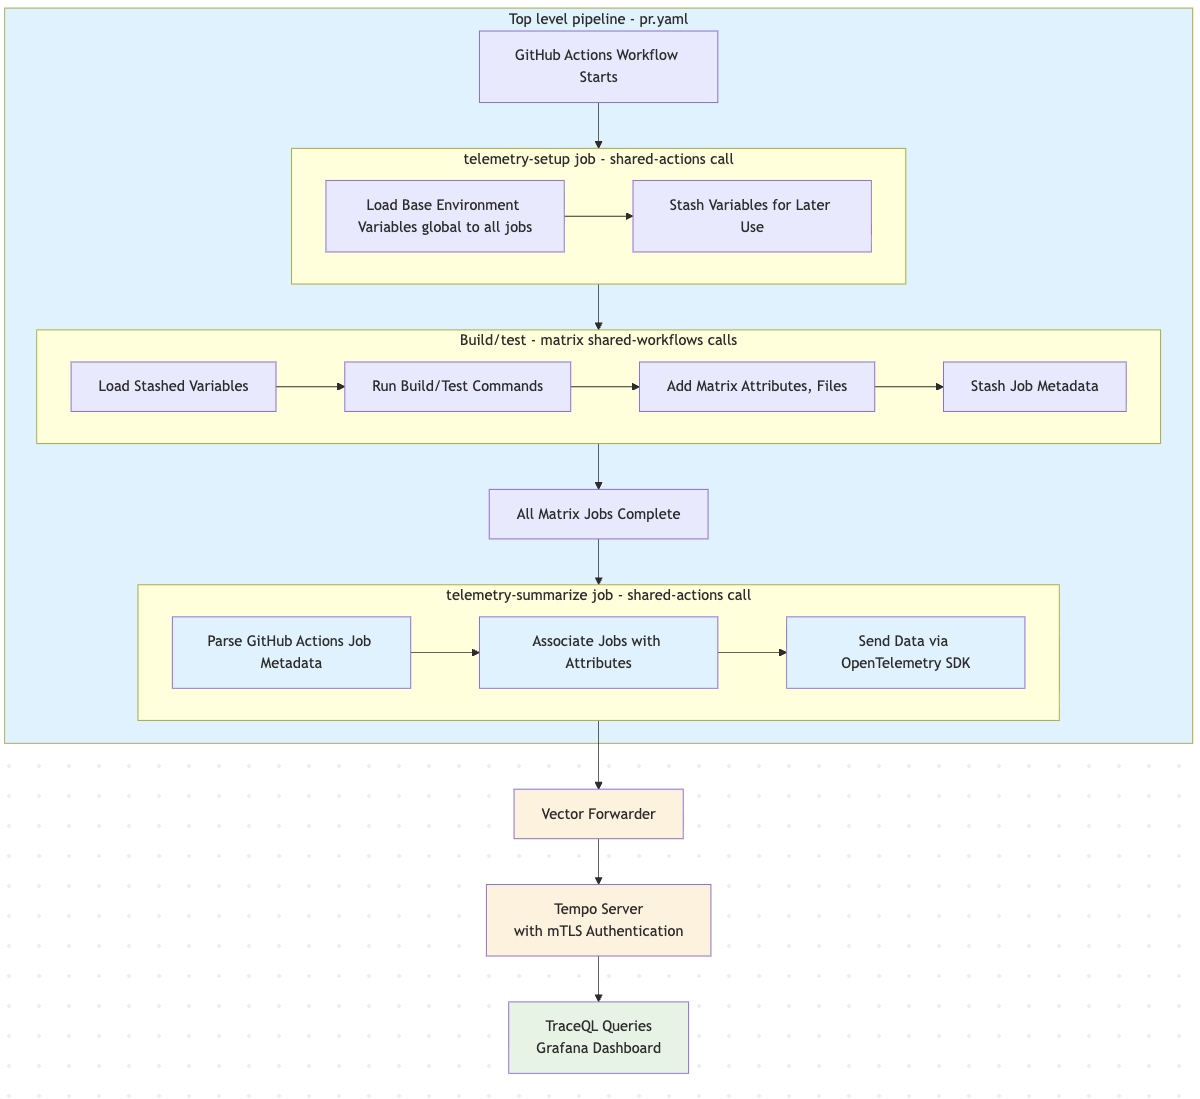
Setup Phase:
telemetry-setupjob runs first, creating base environment variablesExecution Phase: Reusable workflows load variables, add metadata, and execute build/test operations. They stash results to be associated with spans later.
Collection Phase:
telemetry-summarizejob parses GitHub Actions metadata and associates it with workflow attributesTransmission Phase: Data sent via OpenTelemetry SDK through Vector to Tempo. Also happens in telemetry-summarize job in pipeline.
Analysis Phase: Grafana queries Tempo data using TraceQL for visualization and analysis
Code changes for projects to add telemetry#
These are the general steps necessary to add telemetry to a repository that does
not currently have it. This does not describe changes to shared-workflows as
implementation details. In the top-level workflow, such as
cudf/.github/workflows/pr.yaml:
Add a job for telemetry-setup, and add that job name to the pr-builder
needscollection.
jobs:
  # Please keep pr-builder as the top job here
  pr-builder:
    needs:
      - check-nightly-ci
      - changed-files

      ... <other job names> ...

      - telemetry-setup
  telemetry-setup:
    continue-on-error: true
    runs-on: ubuntu-latest
    env:
      # This is useful for distinguishing different pipelines (for example, `pr` vs `build`) but otherwise not necessary
      OTEL_SERVICE_NAME: 'pr-cudf'
    steps:
      - name: Telemetry setup
        if: ${{ vars.TELEMETRY_ENABLED == 'true' }}
        uses: rapidsai/shared-actions/telemetry-dispatch-stash-base-env-vars@main
Add
telemetry-setupas aneeds:entry for all jobs at the top of the tree. The purpose is to communicate telemetry variables that any job may use - even thechecks.yamljob.needs:that generally catch the required jobs are:checks
changed-files
devcontainer
Add an entry to skip the final job from the pr check,
ignored_pr_jobs:
  checks:
    secrets: inherit
    needs: telemetry-setup
    uses: rapidsai/shared-workflows/.github/workflows/checks.yaml@main
    with:
      enable_check_generated_files: false
      ignored_pr_jobs: "telemetry-summarize"
Syntax for the ignored_pr_jobs is space-separated within the quotes.
Run the parsing and submission script job as the final job - after
pr-builder:
  telemetry-summarize:
    # This job must use a self-hosted runner to record telemetry traces.
    runs-on: linux-amd64-cpu4
    needs: pr-builder
    if: ${{ vars.TELEMETRY_ENABLED == 'true' && !cancelled() }}
    continue-on-error: true
    steps:
      - name: Telemetry summarize
        uses: rapidsai/shared-actions/telemetry-dispatch-summarize@main
NOTE: pay special attention to the
runs-onentry. This is what dictates that the job runs on a self-hosted runner, which is necessary for network access control.
Optionally, add steps to your build scripts to copy additional contents to be bundled with your run results. For example, cudf uses a special rapids command that shows the sccache statistics and saves them to a text file in the appropriate location:
rapids-telemetry-record sccache-stats.txt sccache --show-adv-stats
Processing of additional files is automatic, so long as filenames match expected patterns. The currently handled filenames are:
sccache-stats.txt
To add additional filenames/logic to handle, add code to the Python parsing script
Below here is docs on how to maintain the backend parts. Project maintainers should not need anything below here.
Key Components#
Data Collection#
telemetry-setup: Initial job that creates base environment variables
Reusable Workflows: Add operation-specific attributes (CUDA version, Python version, etc.)
Job Metadata: GitHub Actions provides timing and status information after all other jobs have completed
The “meat” implementation of telemetry lives primarily in the shared-actions
repository. As the middle layer, the reusable workflows in the shared-workflows
repo download the stashed environment variables in files from the top-level
telemetry-setup, load them in the local worker’s environment, run the command,
and add possible variables of interest to the stash. Extra variables of interest
capture metadata for that particular job, such as CUDA version, Python version,
CPU arch, or run-specific output such as sccache statistics. You should not
generally need to change shared-actions or shared-workflows when maintaining
other RAPIDS repositories. The content below is only necessary for someone looking to
change or improve something like:
Adding new metadata to associate with a job
Adding telemetry from new sources, such as sccache statistics or build logs
Fixing one or more of what is surely multitudinous bugs
but ideally project maintainers can stop reading now.
Data Transmission#
Self-hosted Runners Only: Required for network access to telemetry infrastructure
Vector Forwarder: Handles authentication and forwarding to Tempo. Configured with k8s
mTLS Authentication: Secure communication with Tempo server
Telemetry data is sent from a python script that uses the python OpenTelemetry SDK. Configuration for this SDK is done with environment variables. Defaults are set in the github action that stashes base environment variables, which runs at the start of each root workflow, e.g. rmm.
Authentication is the biggest complication with receiving data. We use mTLS to allow exposing the Tempo server to the internet without restricting IPs. This means that any server interacting with Tempo needs a set of certificates. It is not viable to manage that for our workers. Instead, we have a Vector forwarder that is only accessible to self-hosted runners. Our runners communicate with the Vector forwarder without needing authentication, and the Vector forwarder is configured with certificates so that it can send the data on to the Tempo instance.
Important reiteration: only our self-hosted runners can send telemetry data. Github-hosted runners will error out.
If you run tempo locally, be sure to adjust Grafana’s datasources.yaml file to point to your desired tempo instance.
Data Storage & Visualization#
Tempo: OpenTelemetry-compatible trace storage. Configuration link
S3 Backend: Persistent storage for Tempo data
Grafana: Dashboard and visualization platform using TraceQL queries. Deployed using K8s as part of a larger helm chart with many pieces.
This is an implementation detail of Tempo. The RAPIDS ops team currently has Tempo backed by S3 to avoid ongoing upkeep requirements of a database server.
Grafana dashboards#
Dashboards are made available by committing them to: https://github.com/nv-gha-runners/arc-nvks-argocd/tree/main/prometheus/resources
These files consist of a short YAML header:
apiVersion: v1
kind: ConfigMap
metadata:
  name: <some-unique-dashboard-name>
  labels:
     grafana_dashboard: "1"
data:
  runner-metrics.json: |-
followed by the JSON that you can export from Grafana.
Dashboard variables#
Grafana has something called “dashboard variables,” which serve to select some value for a particular dimension. Using this as the input to the data filters makes it easy to make multiple plots for different values of the variable (e.g. different machine labels or different RAPIDS repos)
There is a gotcha with variables. Grafana has a way of automatically detecting values for variables - the “Query” variable type. This is the same as Tempo’s search tag values API. When it works, it is very convenient. However, it only works on recent data. If your data was collected some time ago, Grafana may fail to populate these fields. Because of this, it is generally worthwhile to use the “Custom” variable type and manually input variable values, instead of relying on Grafana/Tempo detecting them.
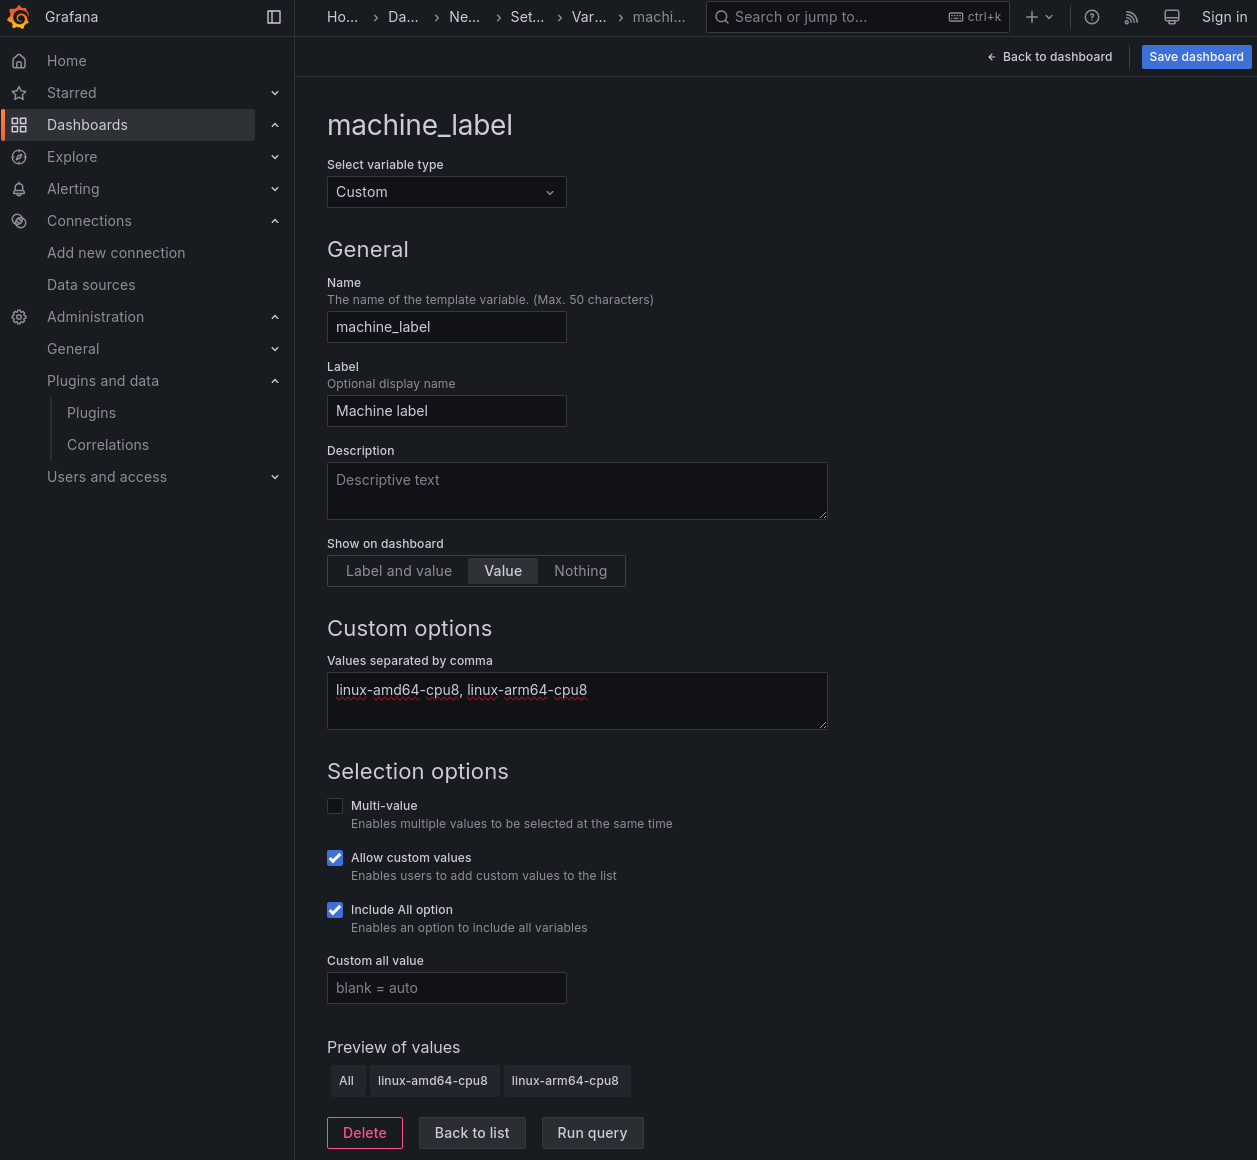
While configuring your variable, if you want to show multiple plots with different values of this variable, be sure to check the “Include All Option” checkbox.
When finished defining your variable and its values, click the blue “Save dashboard” in the upper right. If you navigate away from this page without clicking this button, your variable will not be saved.
Queries#
Queries provide the data from the data source to the panel/visualization. Queries differ based on the data source being used. Tempo’s queries use TraceQL.
Attributes must be included as selectors in the query, or else they won’t be available for filtering down the line. The TraceQL line can get pretty long:
{} | select(span:duration, name, resource.rapids.labels, resource.service.name, resource.rapids.cuda, resource.rapids.cuda, resource.git.job_url, resource.rapids.py, resource.rapids.gpu, resource.rapids.package_type, resource.rapids.arch, resource.rapids.linux, resource.rapids.driver, resource.rapids.deps,span.sccache.main_process.hit_rate,span.sccache.main_process.miss_rate,span.sccache.main_process.error_rate)
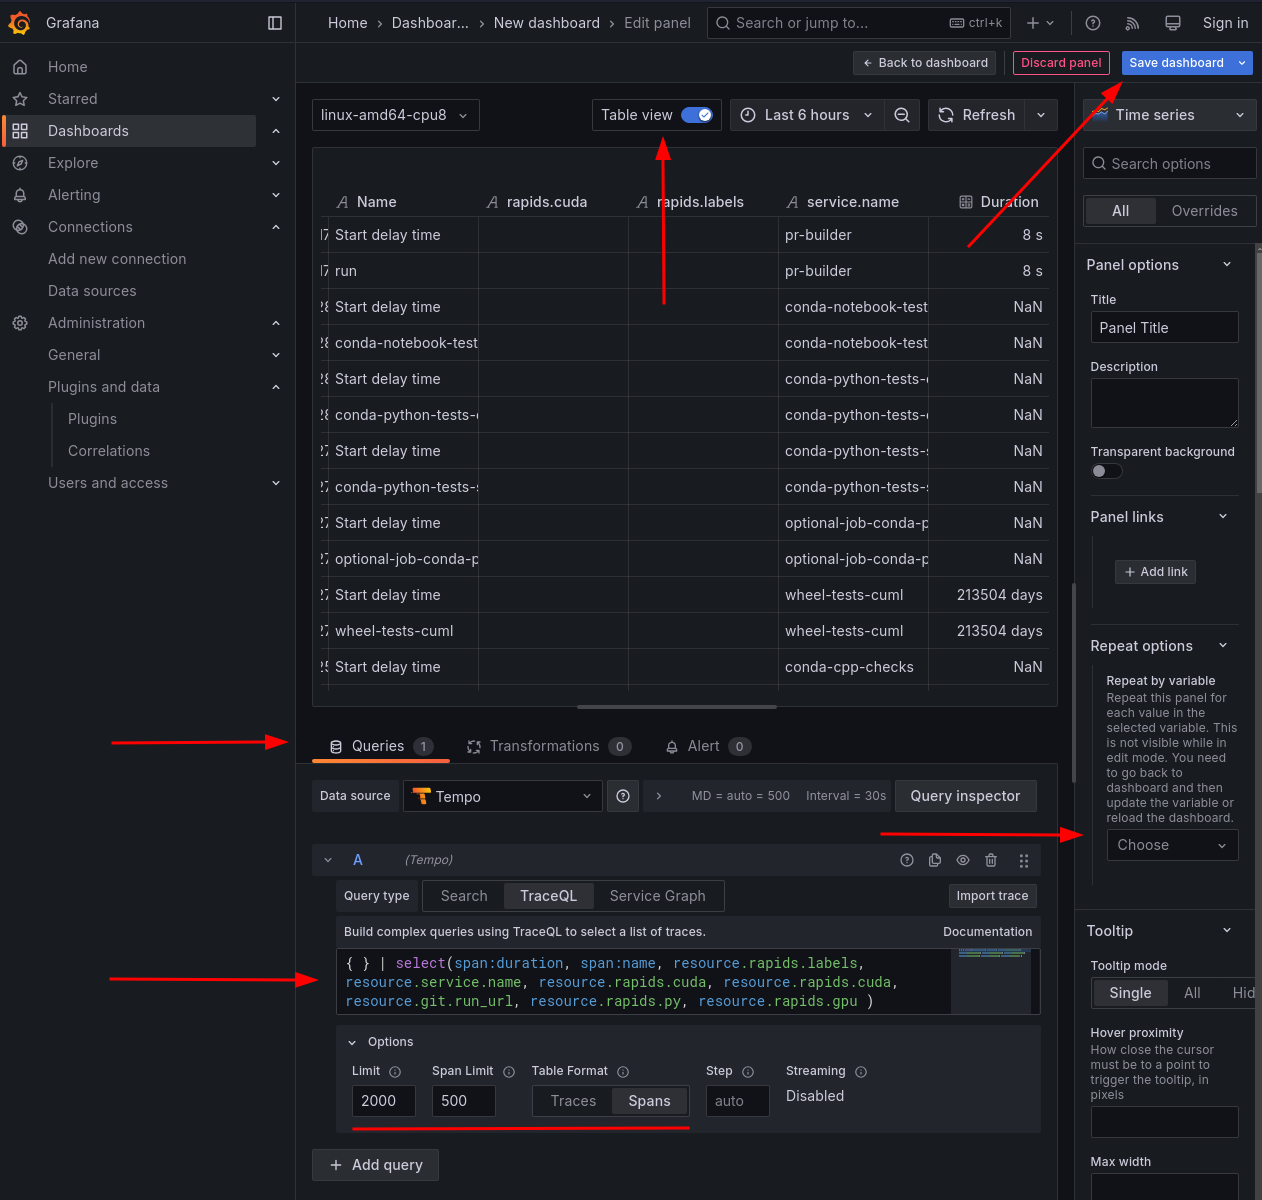
On the right side, take note of the “Repeat options” - this is how you get multiple plots (one per variable value).
On the bottom, take note of the limits and table format. For limits, each trace represents one top-level workflow run. Scale this accordingly, especially if you are looking back far in time. The span limit is less important - you just want this number high enough to capture the largest number of spans for a given trace. It’s fine to set it to a high number, such as 1000 spans. Regarding table format, we are interested in spans, not traces. You will not see the additional metadata columns in the trace table format, because they apply to the spans.
As always, remember to click the upper-right save button after making any changes.
Filtering and grouping data#
We store our span data using Grafana Tempo. Tempo allows TraceQL queries for filtering data. In general, there are two parts of a TraceQL query:
The
{filter}part, which is used to filter the tracesThe
selectpart, which is used to select the metadata fields to return
The query is limited to a certain number of traces and spans per trace, as well as the time range of the query. The maximum time range is 7 days.
The resource-level attributes that are captured can be found in shared-workflows, such as https://github.com/rapidsai/shared-workflows/blob/main/.github/workflows/conda-cpp-build.yaml#L168.
Additional span attributes get added by the python script that uses the OpenTelemetry SDK.
From conda-cpp-build.yaml:
"rapids.PACKAGER=conda,rapids.CUDA_VER=${{ matrix.CUDA_VER }},rapids.PY_VER=${{ matrix.PY_VER }},rapids.ARCH=${{ matrix.ARCH }},rapids.LINUX_VER=${{ matrix.LINUX_VER }}"
From wheels-test.yaml:
"rapids.PACKAGER=wheel,rapids.CUDA_VER=${{ matrix.CUDA_VER }},rapids.PY_VER=${{ matrix.PY_VER }},rapids.ARCH=${{ matrix.ARCH }},rapids.LINUX_VER=${{ matrix.LINUX_VER }},rapids.GPU=${{ matrix.GPU }},rapids.DRIVER=${{ matrix.DRIVER }},rapids.DEPENDENCIES=${{ matrix.DEPENDENCIES }}"
Filter out docker stuff outside of builds#
Part of telemetry setup is providing environment variables that other tools that use OpenTelemetry can use to send spans. These get sent to the aggregator, which may or may not be accessible to the build machine. If the aggregator is accessible, it will be used to send spans. These spans might be useful to you, or they might be noise. To filter them, you can filter by several key attributes.
trace:rootName- The name of the root span. In Grafana, this is the “Trace name” column. It is useful to filter both empty values and “moby.*” which comes from docker, and not of interest.
{trace:rootName !~ ""} && {trace:rootName !~ "moby.*"}
duration- The duration of the trace. This is the “Duration” column in Grafana. It is useful for filtering spurious values.
{duration>10s && duration<1d}
resource.git.job_url- The URL of the job. This is a metadata field that we add, and when this field is empty, it often comes from failed builds that are not of interest.
{resource.git.job_url !~ ""}
resource.rapids.labels- These are the labels of the kind of machine that was used for the job. This filter removes “in-between” jobs, such as the matrix computation, and can also distinguish between build and test jobs.
Workers with GPUs will be associated with test jobs
{resource.rapids.labels =~ ".*gpu.*"}
We’ll call any other label “build”
{resource.rapids.labels !~ ".*gpu.*" && resource.rapids.labels !~ ""}
Any of these can be combined, either within one query, or by combining span sets (joining multiple {} sections).
Adding metadata to spans#
The default spans returned from Tempo only include barebones native attributes. To access the custom attributes that we use to capture GPU, CUDA version, etc., you can use the select function.
{} | select(span:duration, name, resource.rapids.labels, resource.service.name, resource.rapids.CUDA_VER, resource.git.run_url, resource.rapids.PY_VERSION, resource.rapids.GPU)
Reminder: the values in the select function are scoped. resource is a scope that makes the query faster. You can omit it. However, it may be confusing if you try to use a resource scope on an attribute at the span level. The rapids prefix currently implies resource attributes.
Scope:
resource-rapids,gitspan-sccache, likely built file sizes, ninja build times, etc.
Combining filters and spansets#
This is an example of a query that joins filtered spansets, and selects several metadata fields on the resulting spanset.
{duration<1d && duration>10s} && {trace:rootName !~ ""} && {trace:rootName !~ "moby.*"} | select(span:duration, name, resource.rapids.labels, resource.service.name, resource.rapids.CUDA_VER, resource.git.run_url, resource.rapids.PY_VERSION, resource.rapids.GPU)
The returned data here is the foundation of the telemetry dashboard. Beyond the query, the workhorse ideas of the grafana plots are:
filtering data such that it matches a given value
Using groupby operations to aggregate multiple values of a given type
These are on the Transform tab of the same box where the query was entered.
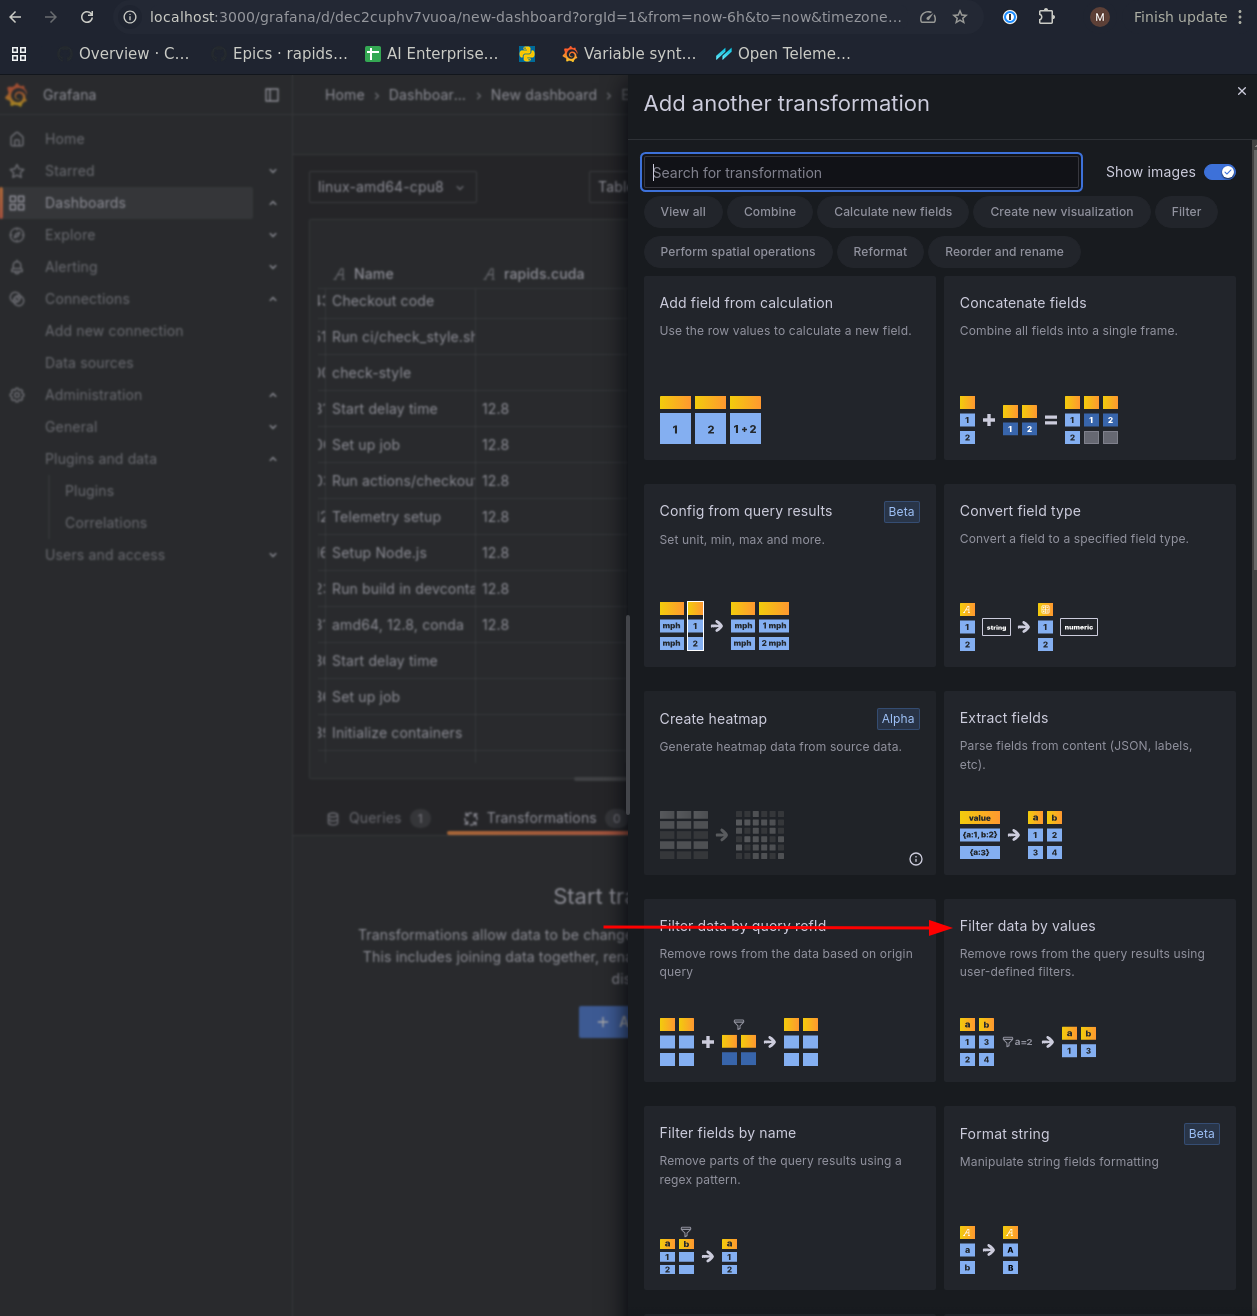
An example useful set of transforms:
-
matching
is not nullon thegit.job_urlis useful for ignoring jobs that were cancelled
-
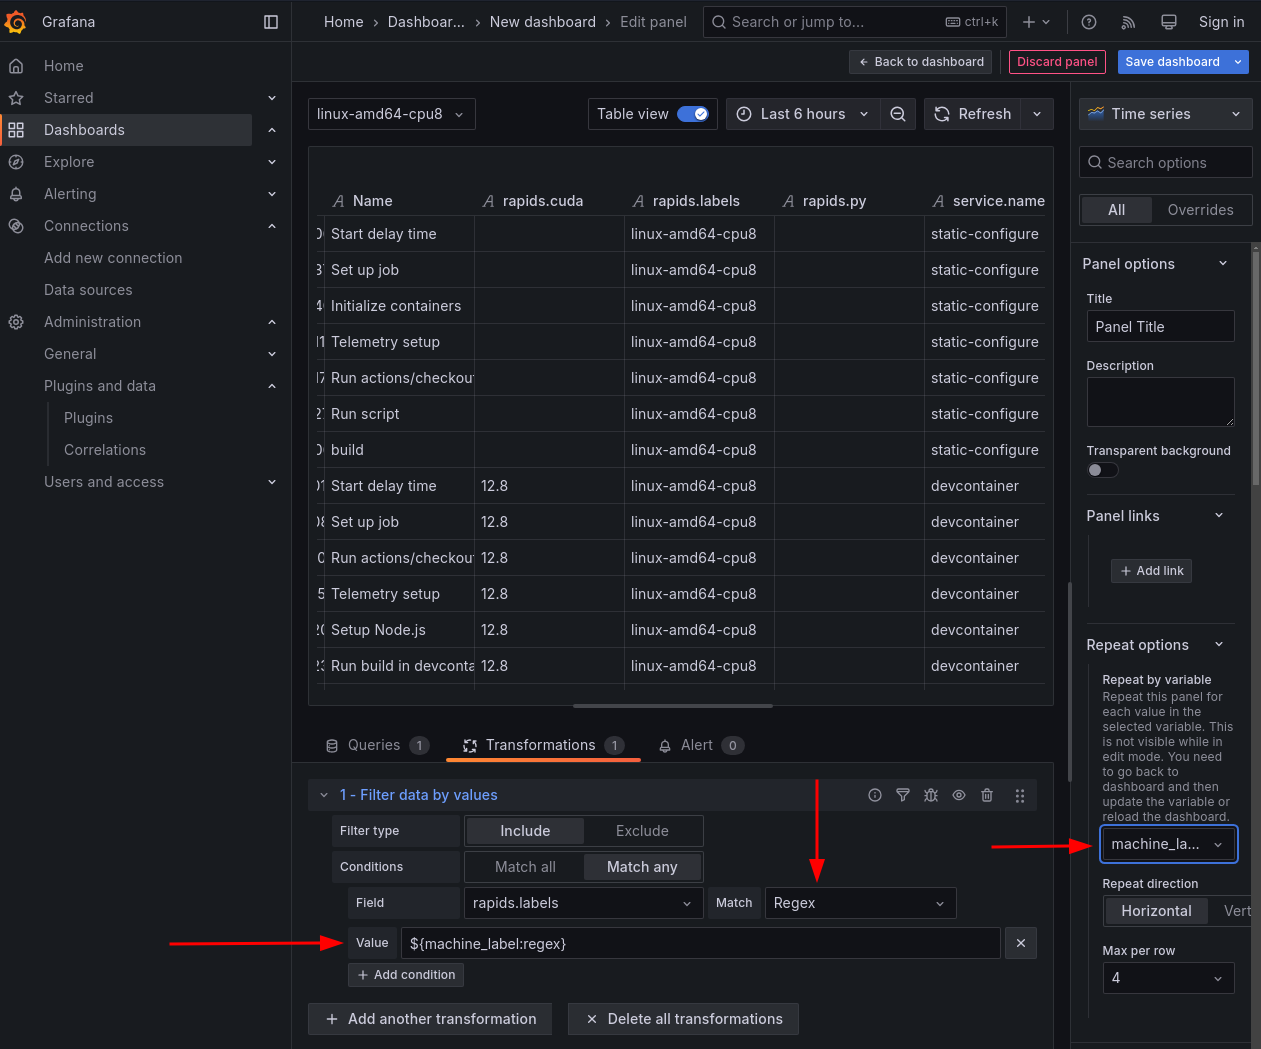
Regexis useful for matching stringsIf using a variable, ensure that Grafana is formatting the variable value correctly. The
regexformatter is appropriate for escaping annoying characters. If your data filter is not functioning correctly - either not filtering values that should be filtered, or not yielding any results, you probably have the wrong formatter.
Group-by is generally useful for averaging or summing multiple values for a given span kind.
You can average the span time for all
wheel-build-cppby project to compare the average wheel build time for each project. This would be a good bar chart.You can sum the span time for all usage by machine label to show resource usage. This is particularly useful when combined with filters and dashboard variables to make multiple plots.
You may need to transform a column of string labels into an enum field for correct grouping. This is done with the Convert field type transformation
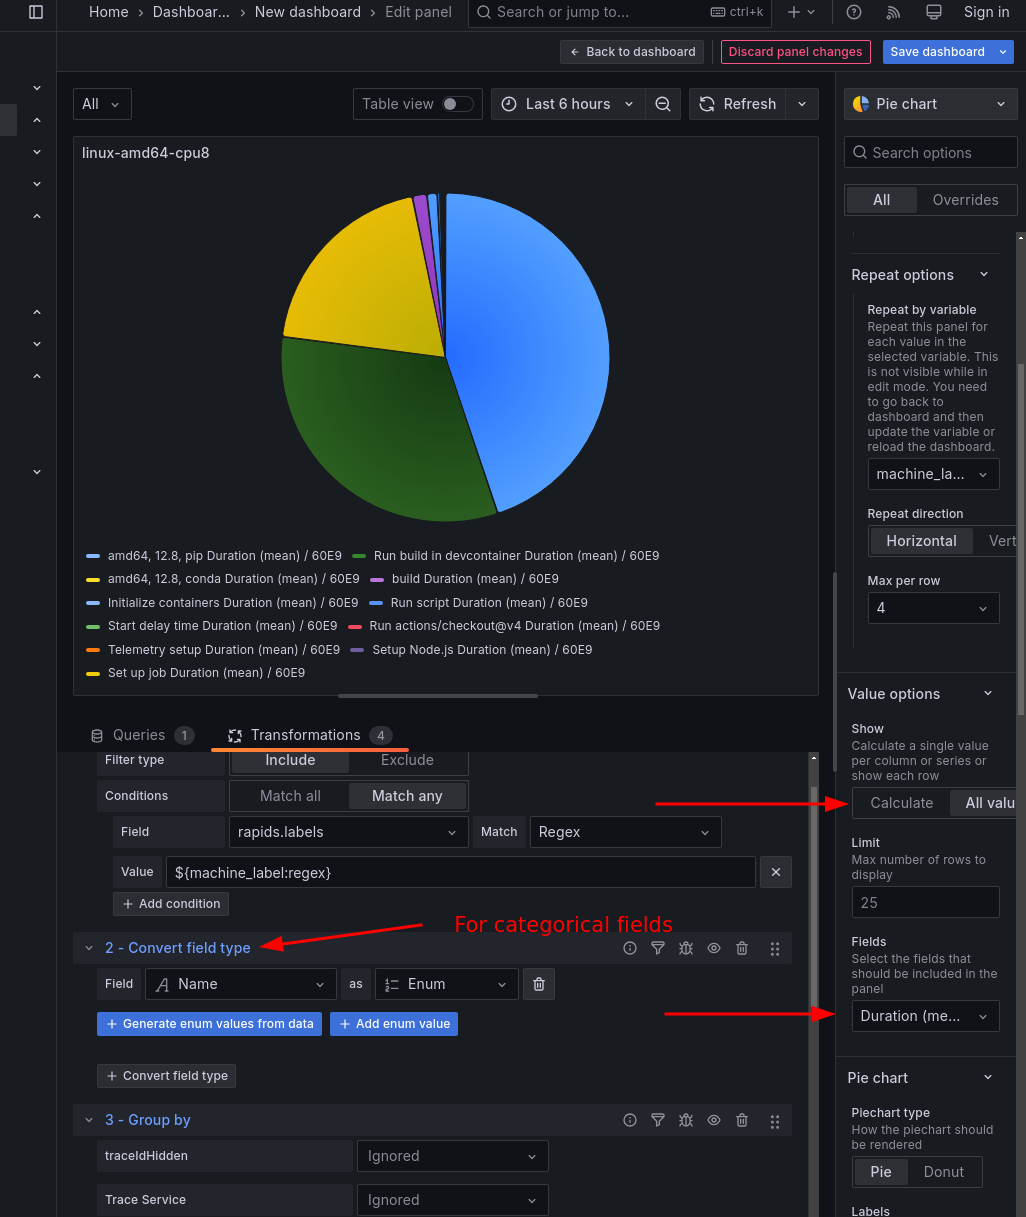
On any chart, Grafana often guesses wrong on the data to display. On the right side of the image above, check the “Value options -> Show”. This often defaults to “Calculate”. It should generally be set to “All values” for our purposes.
Similarly, the “Value options -> Fields” combobox often defaults to “Numeric fields,” but we usually want to point it to a specific field.
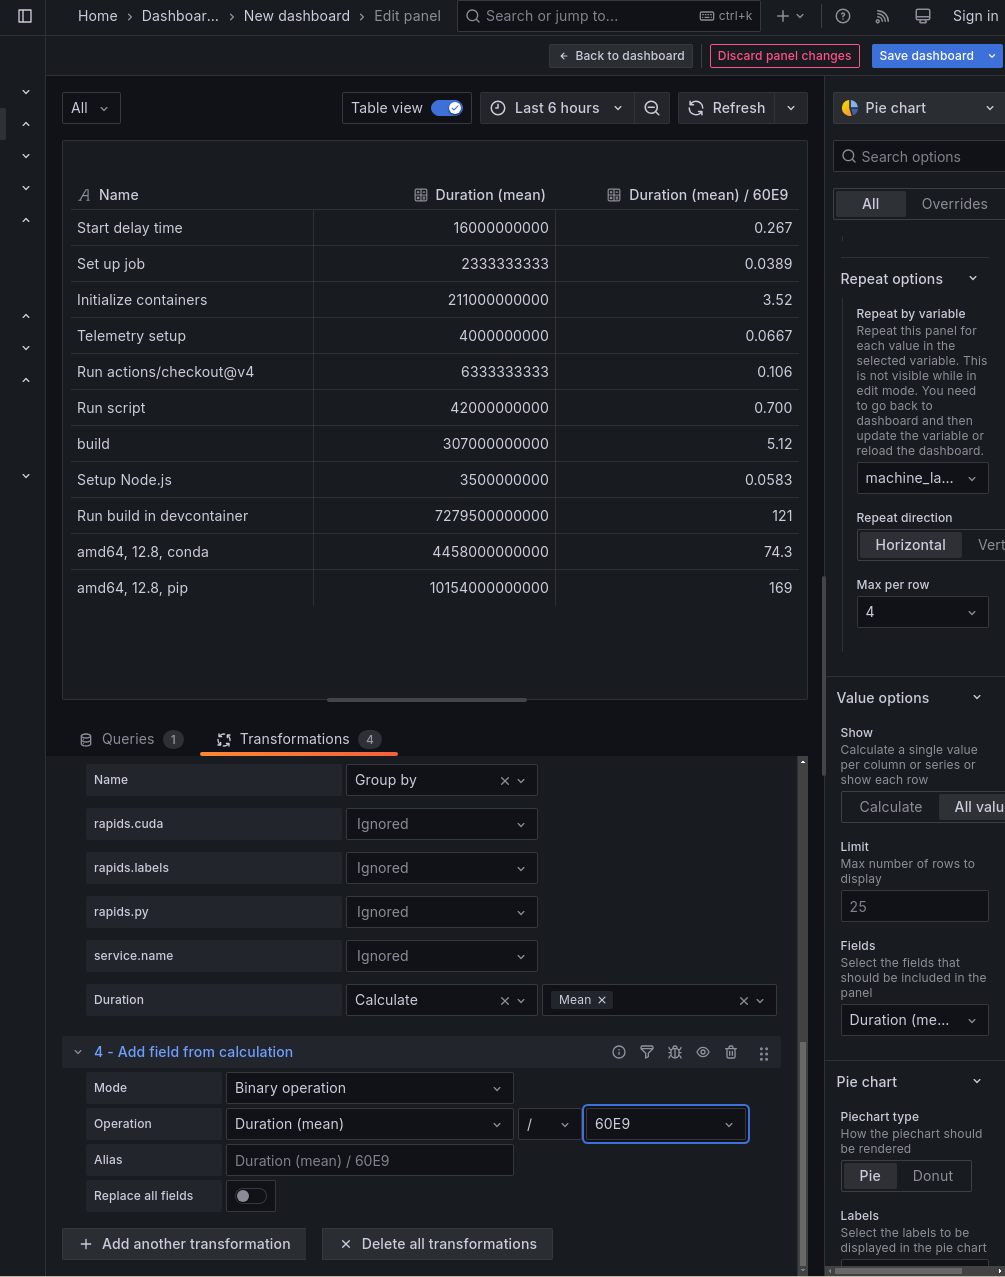
After a group-by aggregation, Grafana can lose track of the duration in terms of nanoseconds. To compensate for this, add an “Add field from calculation” transformation. You can divide nanoseconds by 60E9 to obtain minutes. Keep in mind that this is adding a new column, not altering the old one. You’ll need to select the new column in the “Value options -> Fields” combobox.
Debugging#
It is helpful to be able to send telemetry to some testing server without running workflows. The general steps are:
Run your own instance of tempo locally. The official example docker-compose configuration works fine.
Download a JSON file of your github actions jobs. These are removed by default when a job finishes, but you can preserve it by re-running a job with debug output. The filename is
all_jobs.json. Alternatively, you can fetch it with the Github Actions API.
An example gh cli call that downloads this JSON output:
gh api -H "Accept: application/vnd.github+json" -H "X-GitHub-Api-Version: 2022-11-28" \
    --paginate /repos/rapidsai/cudf/actions/runs/<RUN_ID>/attempts/<RUN_ATTEMPT>/jobs | jq -c '.jobs' > all_jobs.json
Substitute RUN_ID with the value seen in the GitHub web UI for the job that you’re interested in. The RUN_ATTEMPT is usually 1, unless you have retried the job.
Clone the shared-actions repo locally
copy the
all_jobs.jsonfile intoshared-actions/telemetry-impls/summarizecd into
shared-actions/telemetry-impls/summarizeSet key environment variables. At least two options:
Set them on the terminal
```
export OTEL_EXPORTER_OTLP_ENDPOINT=”http://localhost:4318” export OTEL_EXPORTER_OTLP_PROTOCOL=”http/protobuf” export OTEL_TRACES_EXPORTER=”otlp_proto_http”
(OR) Use VS Code run configurations
```
{
    "name": "send-tempo",
    "type": "debugpy",
    "request": "launch",
    "program": "send_trace.py",
    "console": "integratedTerminal",
    "cwd": "${workspaceFolder}/telemetry-impls/summarize",
    "justMyCode": false,
    "env": {
        "OTEL_EXPORTER_OTLP_ENDPOINT": "http://localhost:4318",
        "OTEL_PYTHON_LOG_LEVEL": "DEBUG",
        "OTEL_EXPORTER_OTLP_PROTOCOL": "http/protobuf",
        "OTEL_TRACES_EXPORTER": "otlp_proto_http"
    }
},
(optional) Run bump_time.py script to adjust timestamps in your
all_jobs.jsonfile. The Grafana UI shows data that is a certain amount of time prior to the present. Not updating timestamps can lead to your data points being too far back in time to show up.Run send_trace.py. The requirements.txt file is alongside send_trace.py.